Pro-fibrotic gene expression assay

Cellular transformation into myofibroblasts is a central physiological process enabling tissue repair. Its deregulation promotes fibrosis and carcinogenesis. Transforming growth factor-β1 (TGF-β1) is the main inducer of the contractile gene program that drives myofibroblast differentiation from various precursor cells. TGF-β1 drives the production of α-smooth muscle (α-SMA) actin, which gives the myofibroblasts their contractility. Myofibroblasts derived from Dupuytren’s nodules spontaneously produce a host of cytokines, chemokines and growth factors including TGF-β1, thus driving the chronicity of the disease. Duypuytren’s disease nodules are characterized by high level of expression of numerous collagen including Collagen I, II, IV and VI. Collagen III is particularly associated with early disease. A greater understanding of the regulatory mechanism driving the expression of these pro-fibrotic mediators within diseased tissue effector cells is key to the development of new therapeutics.
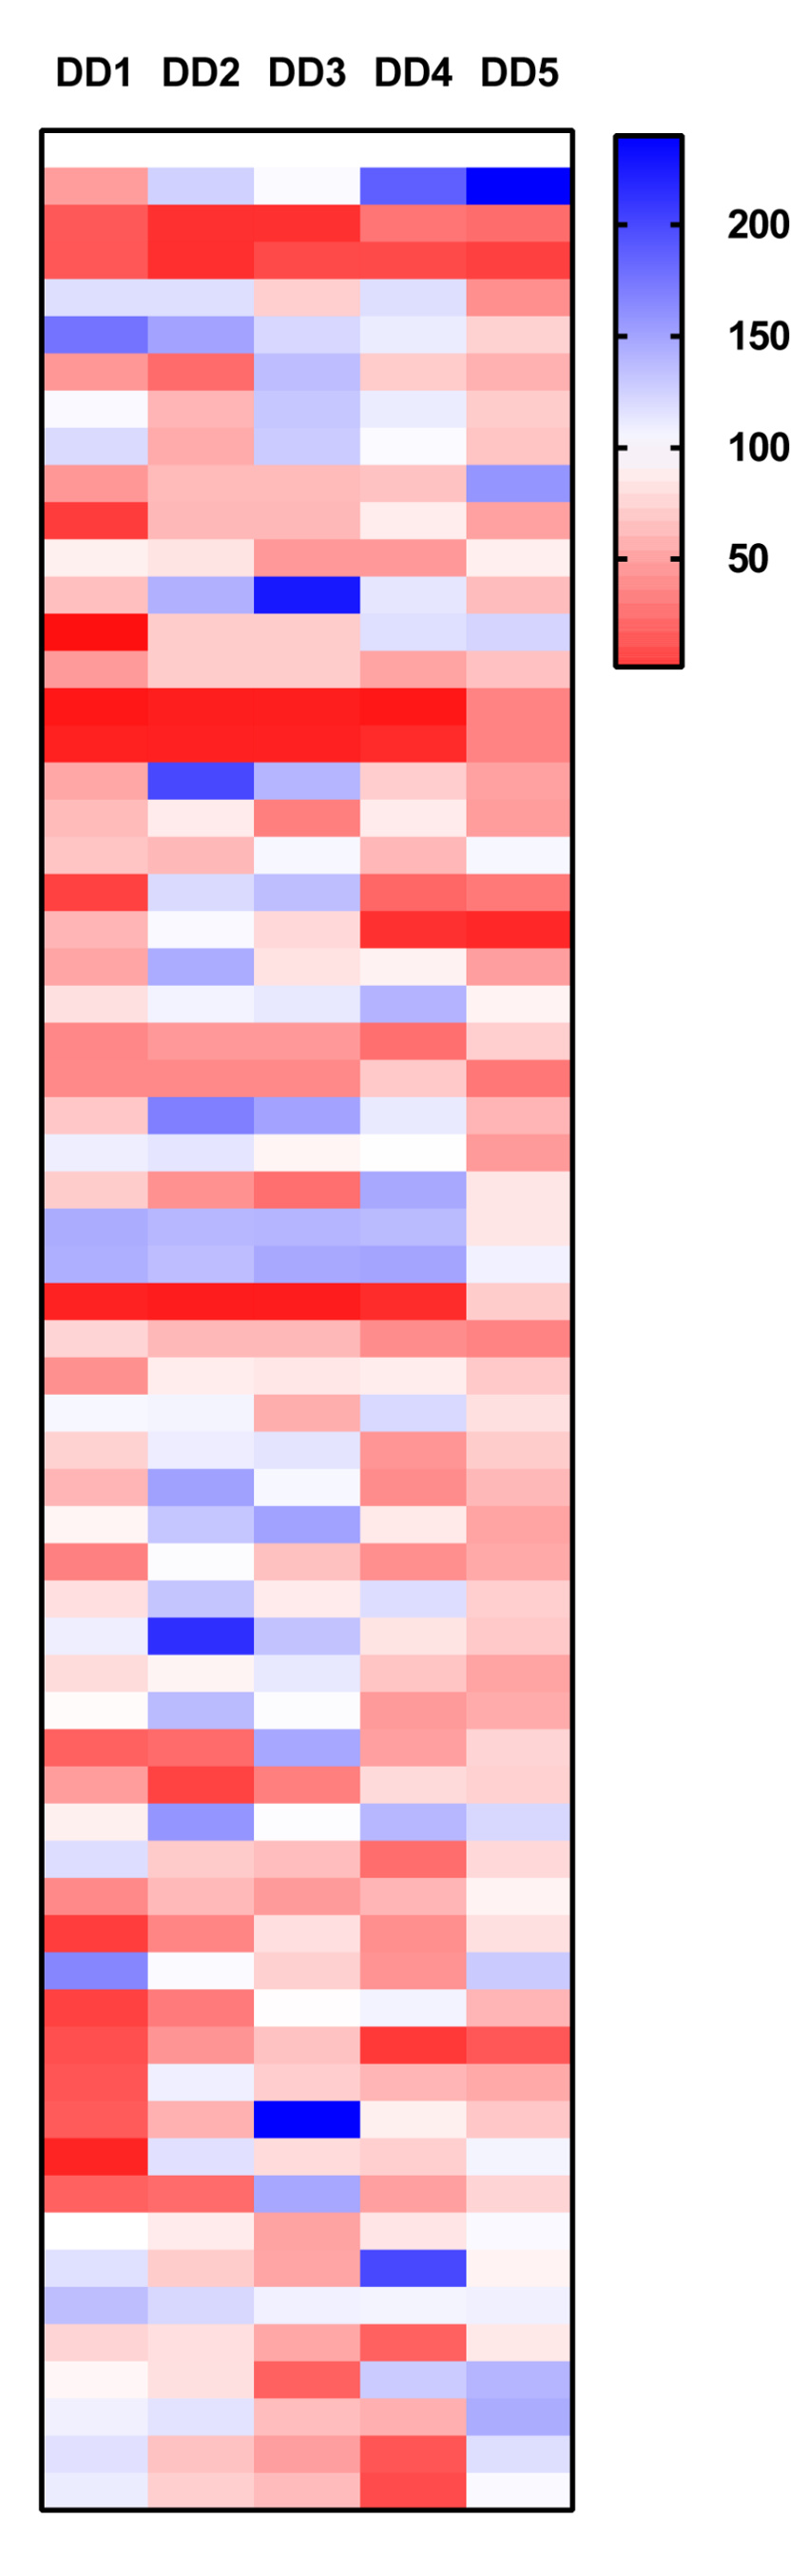
We set up the qPCR method to assay to analyze the effect of the probe set on the steady state expression of highly expressed pro-fibrotic genes in DD myofibroblasts. Using surgically excised tissue from Dupuytren’s patients we derived early passage myofibroblast2 (p2). Cells are allowed spread and adhere then treated with probes for 3 days and the effect on gene expression of TGFB1 and Col3A1 is determined by Taqman qPCR.
TGFB1
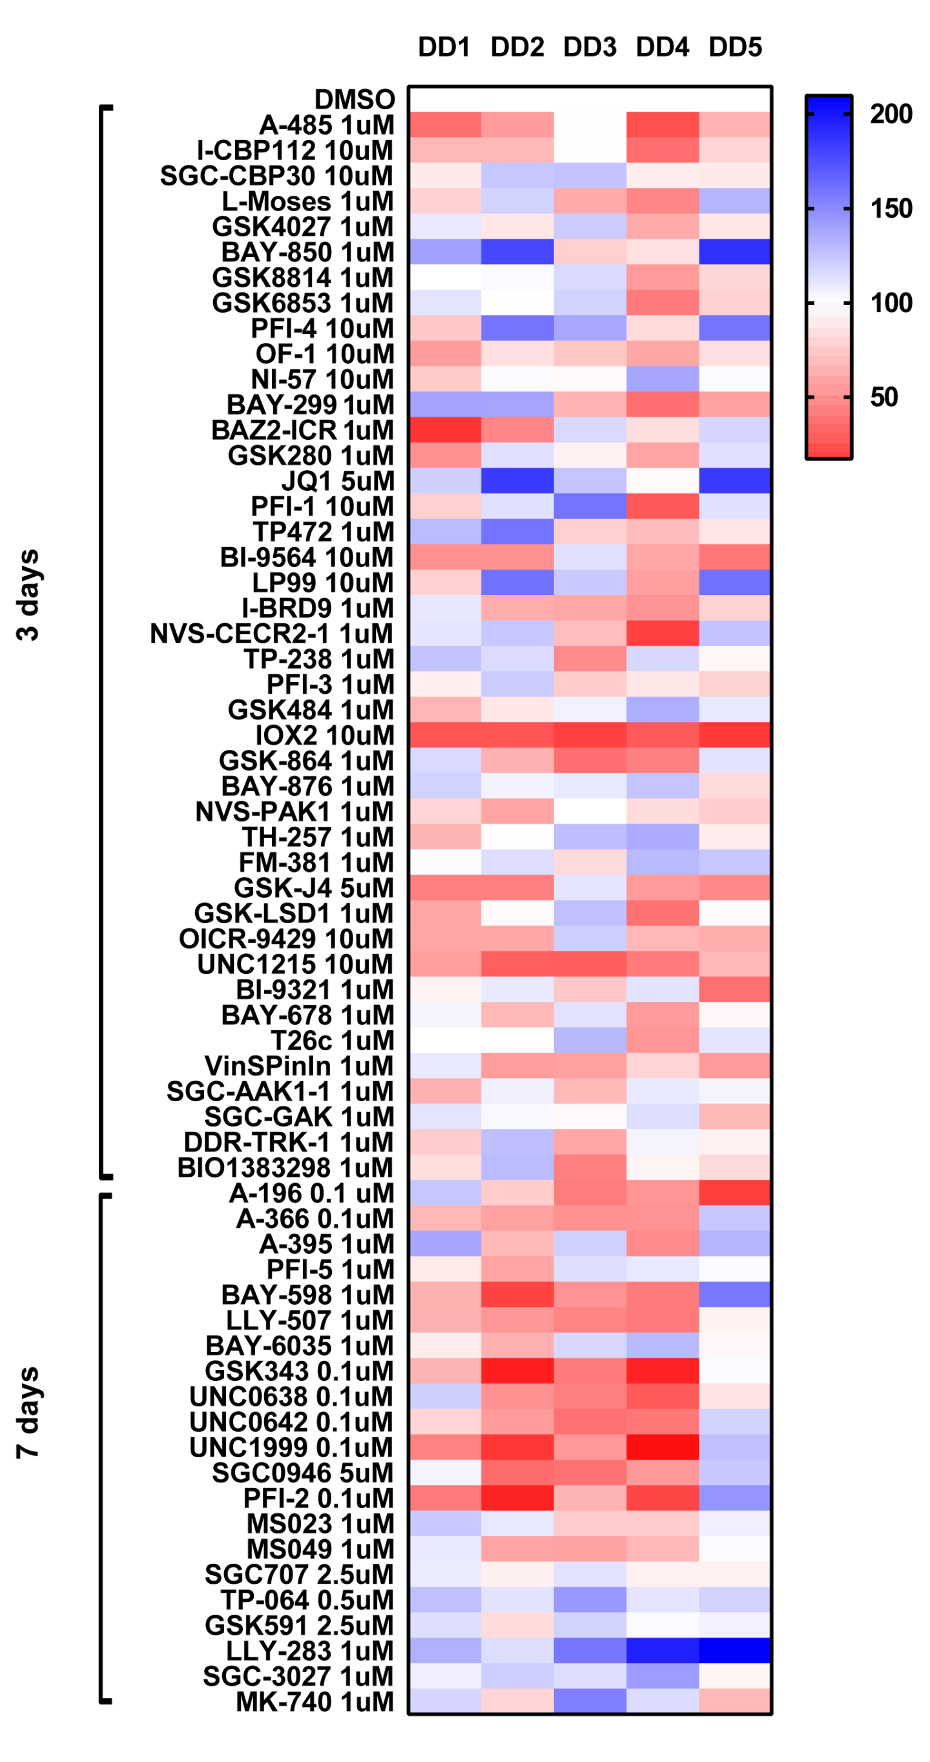
UNC1215 the selective chemical probe for the Kme reading function of L3MBTL3 and IOX2 is a prolyl-hydroxylases (PDH) inhibitor where the only 2 probes which consistently inhibited TGFB1 gene expression in all 5 patient samples.
COL3A1
The bromodomain probes SGC-CBP30 and I-CBP112 (CBP/EP300) and JQ1 and PFI-1 (BRD4) significantly inhibited COL3A1 gene expression. The other probe which consistently displayed a high level of inhibition was observed with the histone demethylase inhibitor GSK-J4.
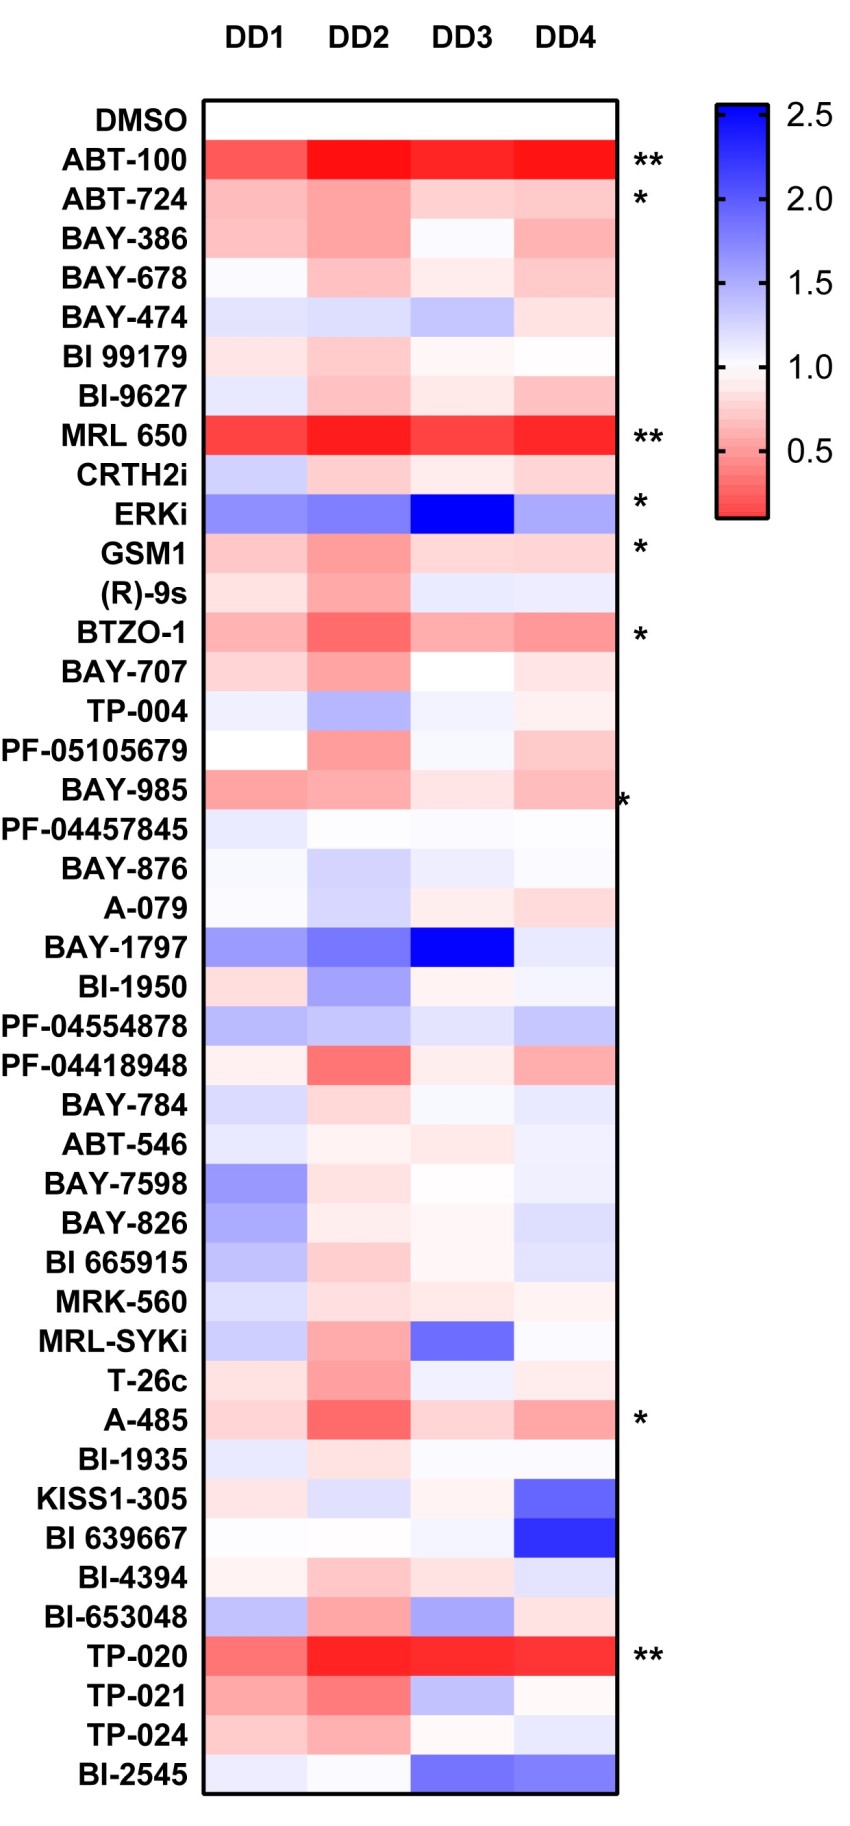
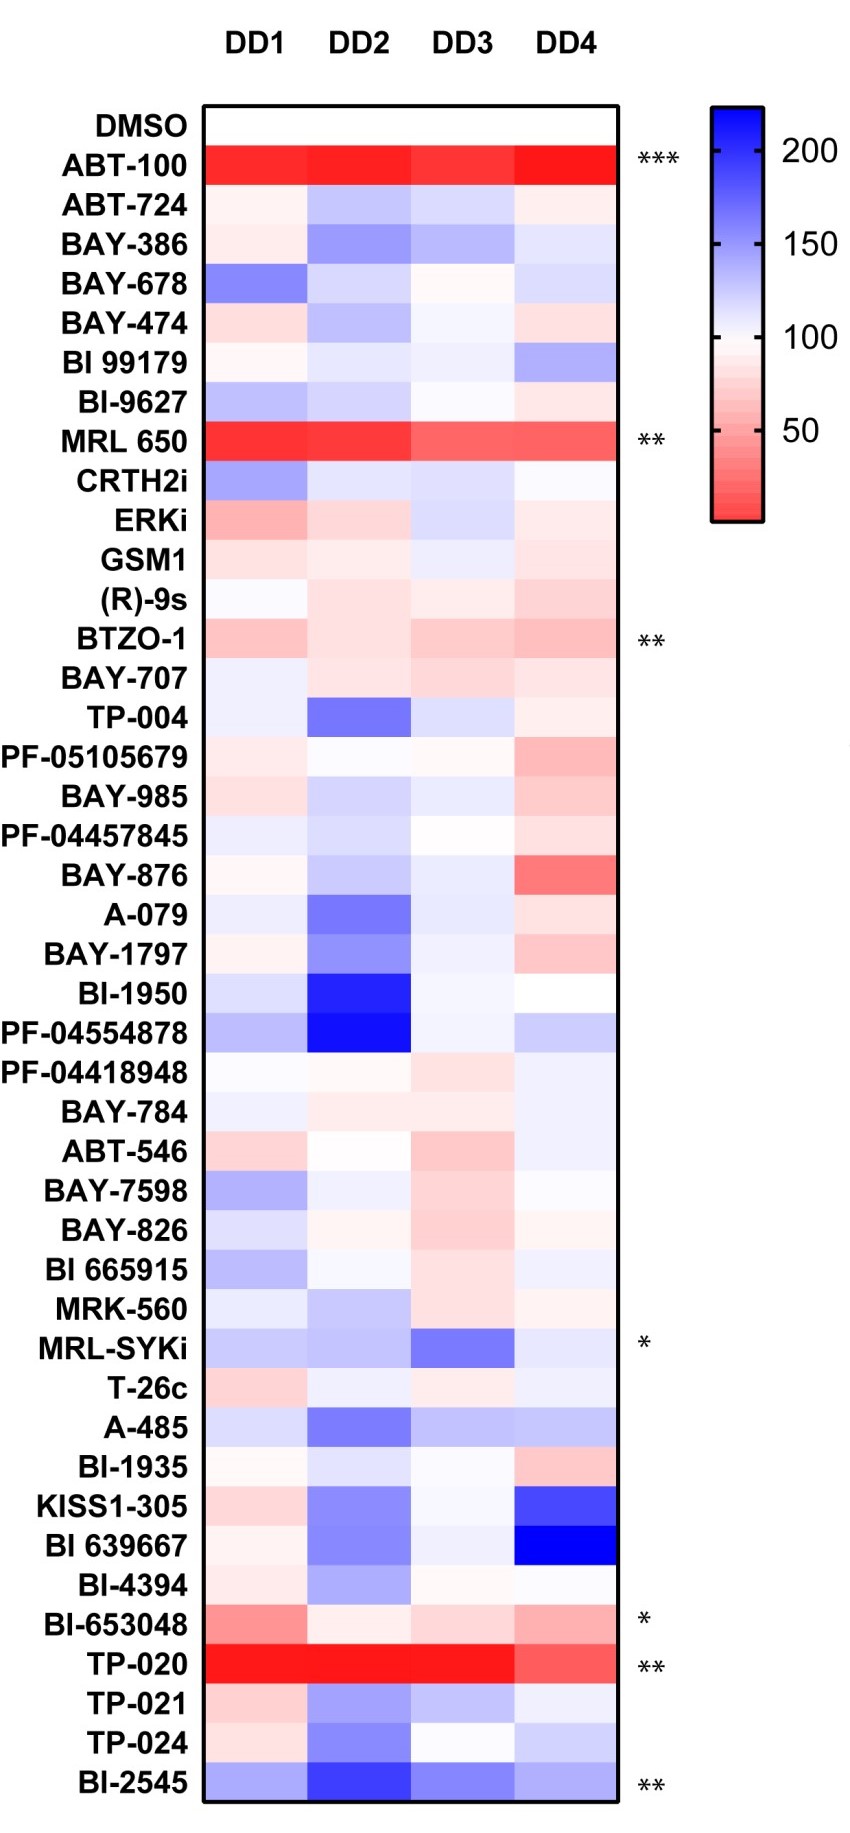
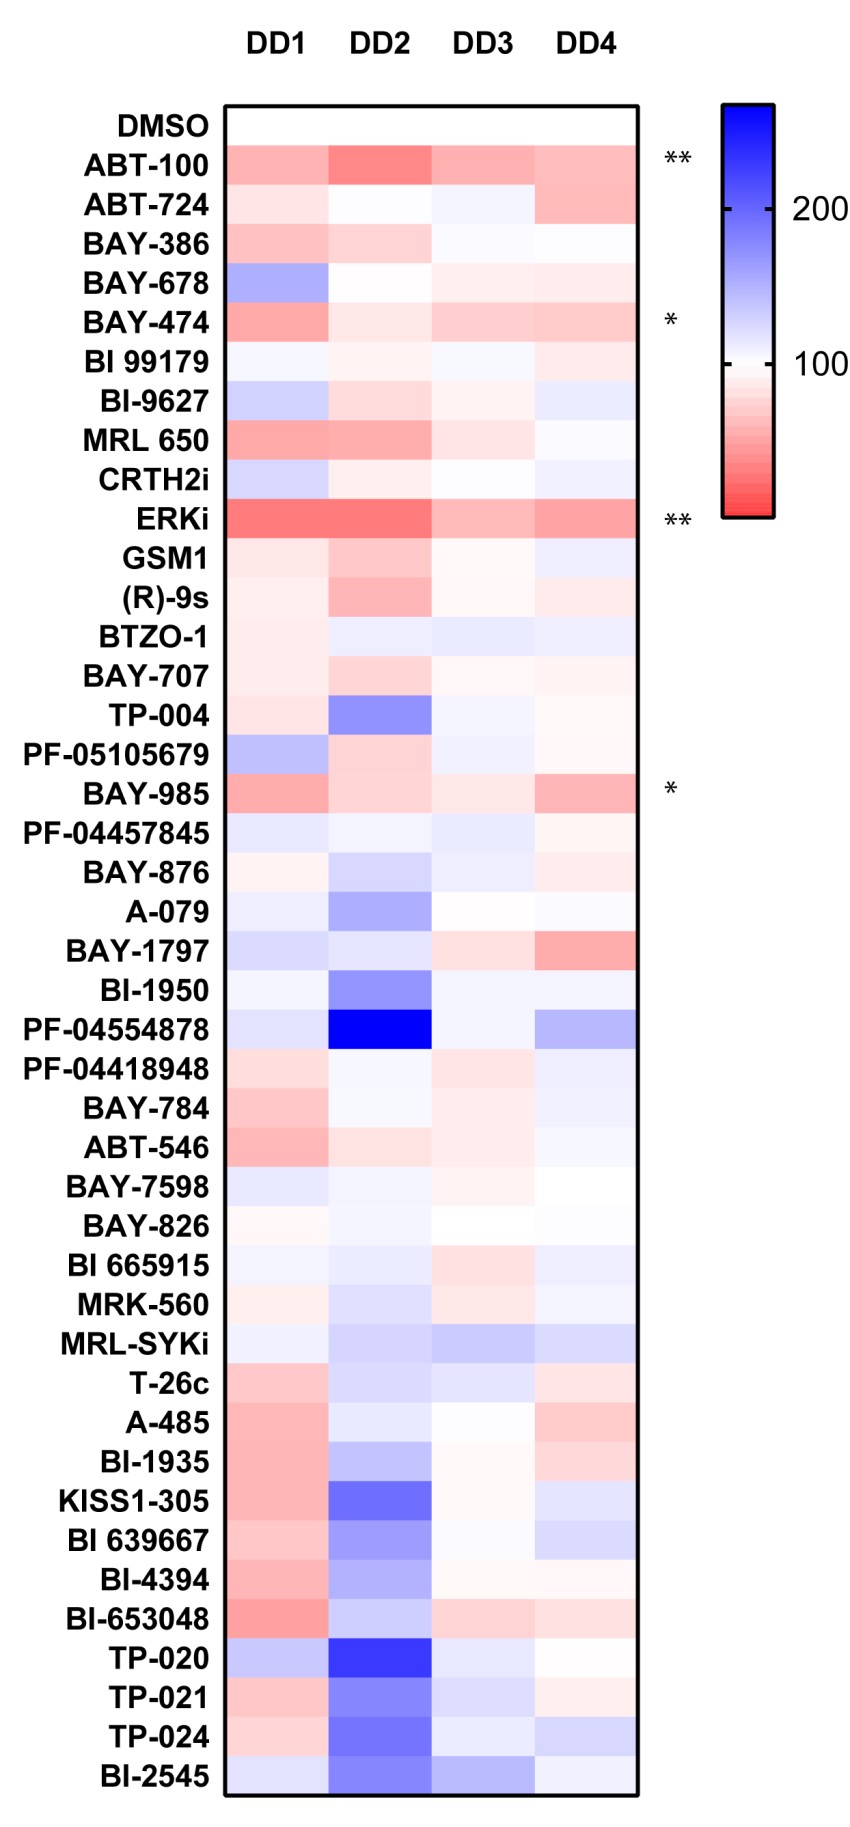
Donated control panel
We have now screened 42 compounds from the donated probe set in this assay and observed strong inhibitory activity with the Farnesyltransferase inhibitor ABT-100, which showed striking inhibitory activity in all 4 genes analyzed. The Cannabinoid Receptor 1 agonist MRL-650 and TP-20 an inhibitor of the Golgi enzyme catalyzing an essential step in the conversion of oligomannose to complex N-glycans (MGAT2) also showed strong inhibitory activity towards ACTA2, COL1A1 and COL3A1 gene expression.
Experimental Protocol ACTA1, COL1A1, COL3A1 and TGFB1 gene expression assays
- Surgically excised tissue from Dupuytren’s patients was treated with collagenase to derive single cell suspensions; cells were passaged (p2) and are termed myofibroblasts.
- Cells were seeded in 48 wells at 5 x10³/well and left to adhere overnight. The following day probes were added, using DMSO as the vehicle control. Probes (0-10µM) were incubated with the cells for 3 days or in the case of methyltransferase (MT) probes 7 days (cells were treated with MT probes again at day 3). The donated probe set were incubated at 1uM for 3 days. For the donated probe set screen, cells were incubated with1uM probe for 3 days.
- At the end of the assay period RNA was extracted using Direct-Zol™ RNA kit and cDNA was generated using the RNA-Ct kit (Life Technologies). Gene expression was determined by quantitative PCR on a ViiA™7 using Taqman™ Fast Advanced Mastermix (Life Technologies) and Assay-On-Demand premixed Taqman™ probe master mixes. The relative gene expression of COl3A1 and TGFB1 was calculated using the ΔΔCt method with the GAPDHgene for normalization of mRNA levels.
- Data is expressed as % compared to DMSO control (100%), DD1-5 Dupuytrens’s disease patients.
ACTA2 (SMA)
COL1A1
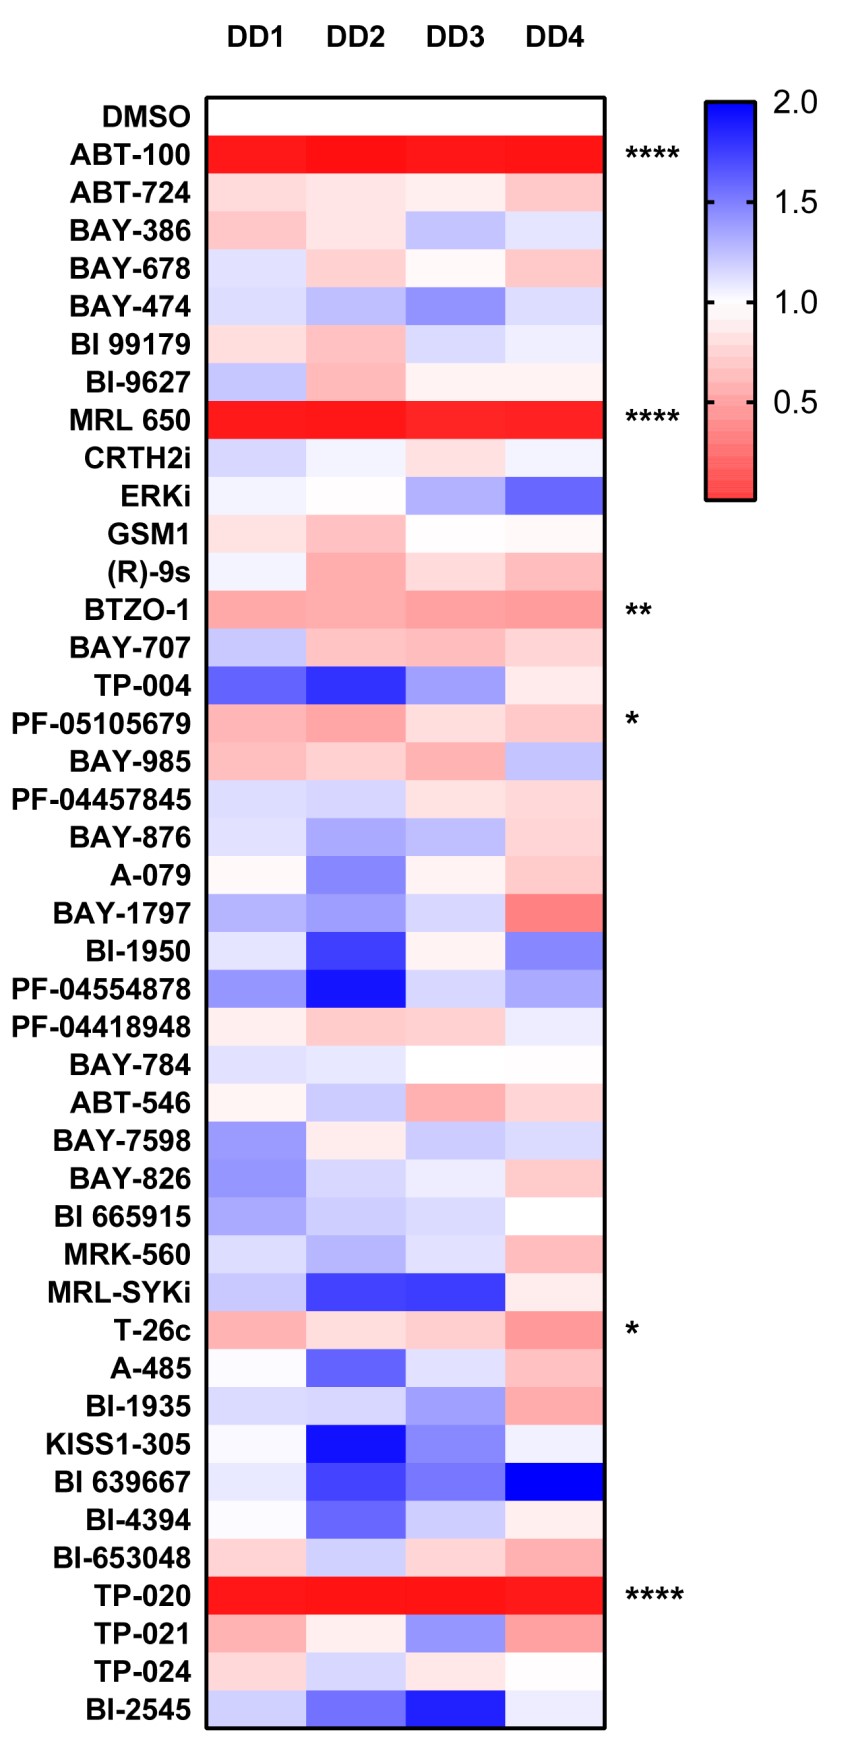
P value was determined by one sample t test to normalised control (DMSO) sample of 1.
P *<0.05, ** P<0.01, *** P<0.001, **** P<0.0001
COL3A1
TGFB1
P value was determined by one sample t test to normalised control (DMSO) sample of 1.
P *<0.05, ** P<0.01, *** P<0.001, **** P<0.0001
TGFB1
COL3A1